Simulate data for CCW project

Causal Directed Acyclic Graph

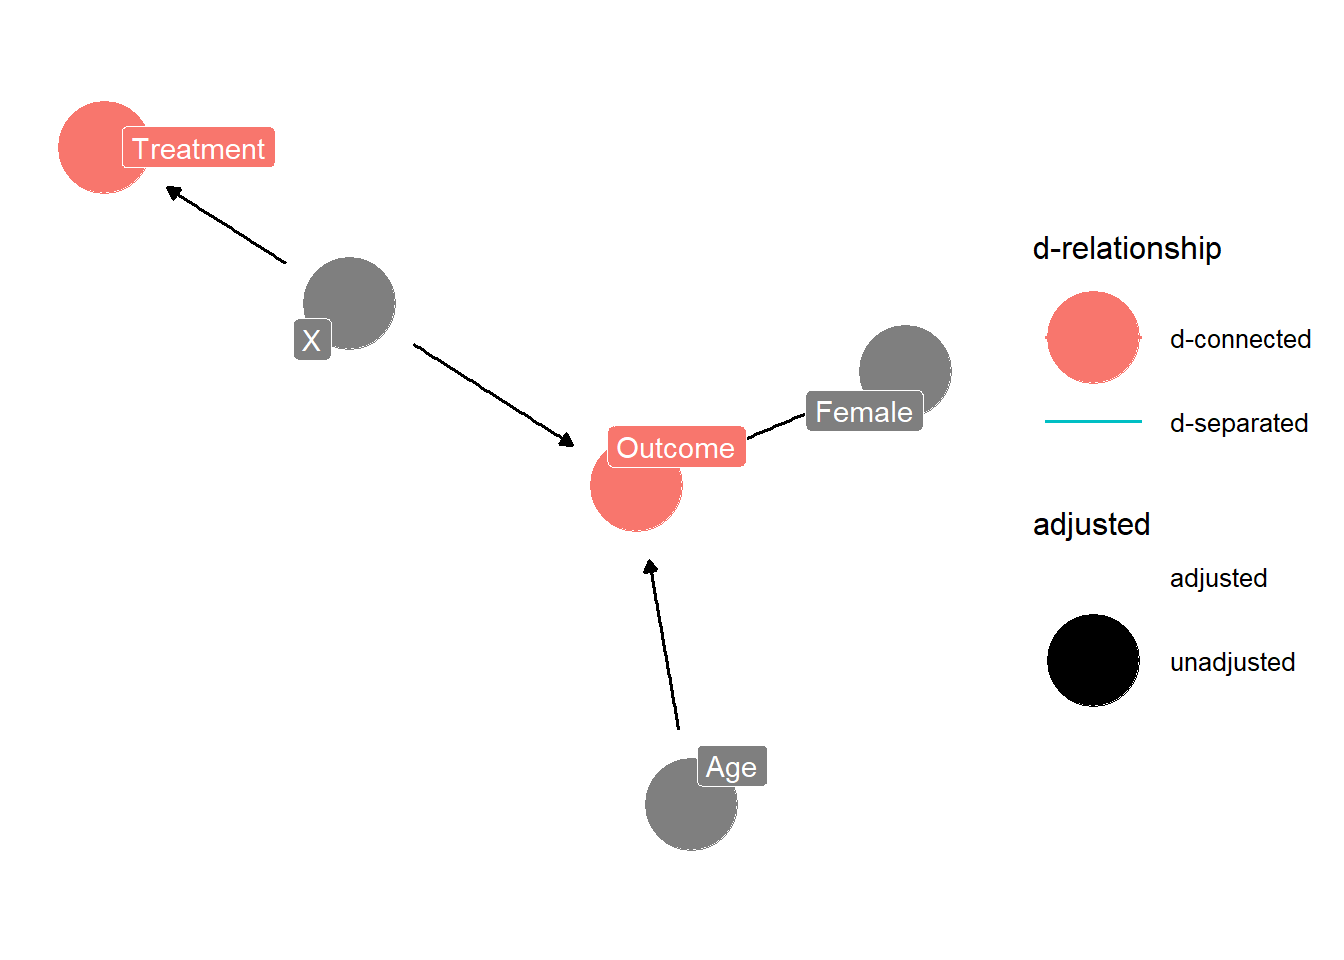
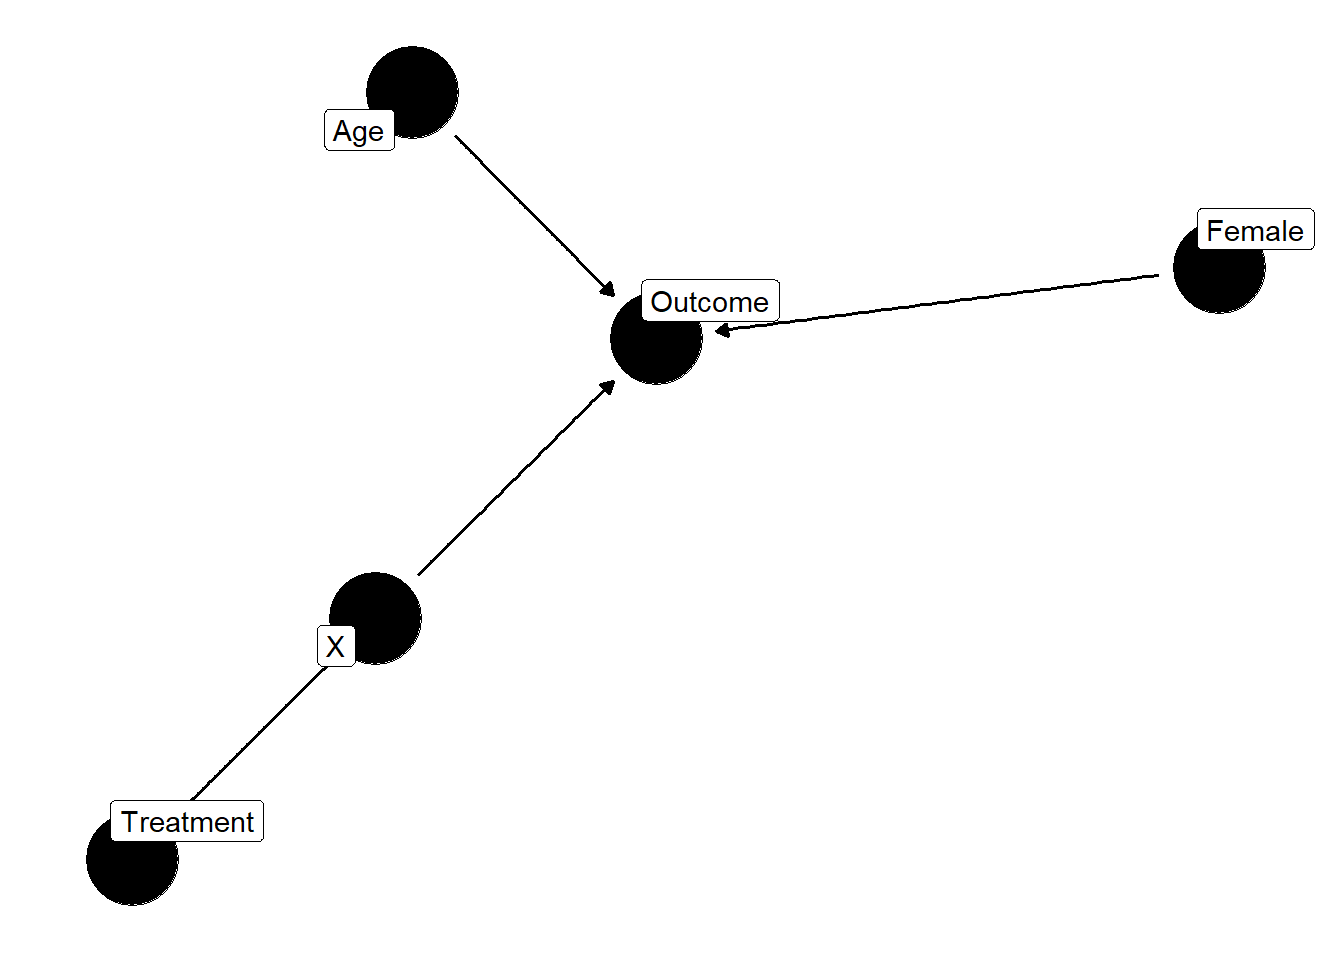
We assume a generic treatment, A, has no causal effect on generic outcome, Y. However, confounding is present through another random variable. The DAG includes age, X a confounder, gender defined through a binary variable F for female. X is both a baseline variable, and a time-varying confounder. Below we assign effects of these variables that will lead to identification of a causal effect between A and Y, if no controlling for the confounding is done.

Figure 1. Causal DAG of treatment and outcome

If a naive analysis (no adjustment) was performed the estimate will be biased, because treatment and outcome are d-connected.

Figure 2. D-connected treatment and outcome

Figure 3. D-separated treatment and outcome after adjustment

Adjustment for X should lead to identification of a NULL effect of treatment on outcome.

Simulation Parameters

set.seed(100)
1n = 10000L
fup = 90

2df = tibble(id = 1:n,
            age = round(rnorm(n, mean = 75, sd = 10), 1),
            female = sample(c(1, 0), size = n, replace = TRUE, prob = c(0.66, 0.34)),
            fup = fup,
            X = rnorm(n, 0, sd=1),
            )
  
setDT(df) 
3d_panel = df[rep(seq(.N), fup)]
d_panel[, exit := (seq_len(.N)), by = list(id)]
d_panel[, enter := exit-1]
d_panel[, time := seq_len(.N), by = list(id)]
1
Specify 10000 individuals with 90 observation periods of follow-up.
2
Specify covariates, age, female and X.
3
Expand dataset, each observation period is an interval of length = 1.

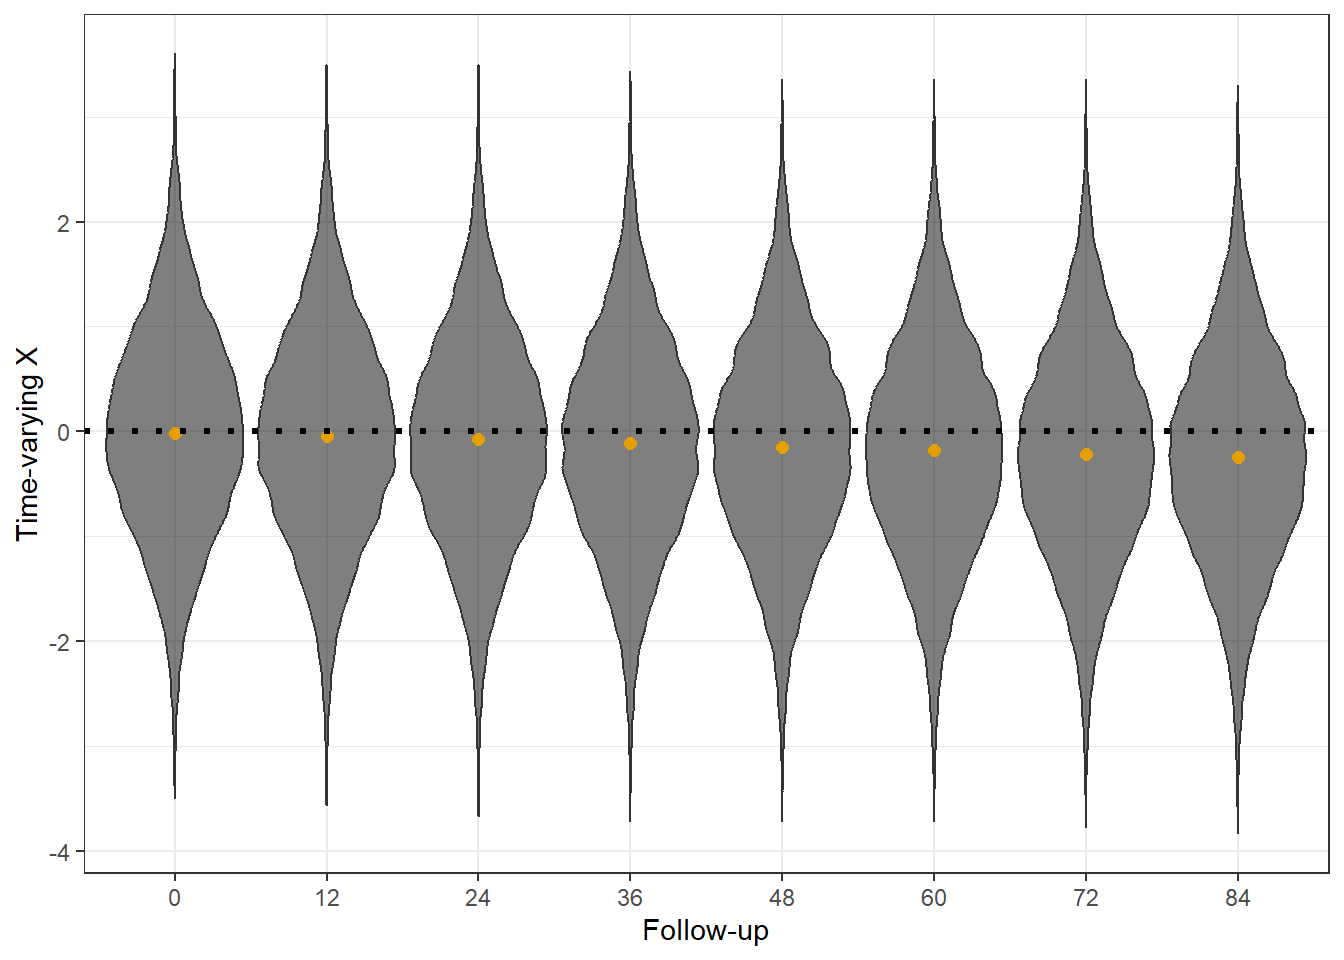
For X, further include X_t which varies across time. A change in X_t is triggered by intermediate variable X_shift which is a random binomial draw (meant to represent a triggering event for a change in X). So for each person, there is a baseline X, then random timepoints in follow-up where X changes.

d_panel[, X_shift := rbinom(.N, 1, 0.05)]
d_panel[, X_shift := cumsum(X_shift), by = list(id)]
d_panel[, X_t := X+(X_shift*(rnorm(1, 0, 1)))]

Figure 4. Distribution of Time-varying Confounder

Time to treatment and outcome is simulated in a longitudinal dataset, to allow for time-varying effect of X. Then the dataset is modified so that persons follow-up ends at the time of outcome:

  set.seed(101)
  
  d_panel_2 = d_panel %>% 
1    # Treat event
    mutate(log_odds = -4.1 + 0.0001*time + -0.00001*(time^2) + 0.2*X + 0.2*X_t,
           p = exp(log_odds) / (1 + exp(log_odds)),
           treat = rbinom(n(), size = 1, prob = p),
           treat = if_else(treat==1, 1, NA_integer_)
    ) %>%
    group_by(id) %>%
      fill(treat, .direction = 'down') %>%
    ungroup %>%
    mutate(treat = coalesce(treat, 0L)) %>%
2    # Outcome event
    mutate(log_odds = -5 + 0.009*time + 0.0003*(time^2) + 0.4*X + 0.3*X_t + 
                                  -0.2*female + 0.07*age + -0.001*(age^2),
           p = exp(log_odds) / (1 + exp(log_odds)),
           outcome = rbinom(n(), size = 1, prob = p),
           outcome = if_else(outcome==1, 1, NA_integer_)
    ) %>%
    group_by(id) %>%
      fill(outcome, .direction = 'down') %>% 
    ungroup %>%
    mutate(outcome = coalesce(outcome, 0L)) %>%
3    group_by(id) %>%
      mutate(t_outcome = coalesce(min(time[outcome==1]), Inf),
             t_treat   = coalesce(min(time[treat==1]), Inf)) %>%
    ungroup %>%
    dplyr::filter(outcome  == 0 | time == t_outcome) %>%
    dplyr::filter(time <= 60) %>%
    mutate(t_treat = if_else(t_outcome < t_treat, Inf, t_treat),
           t_treat = if_else(60 < t_treat, Inf, t_treat))
1
Simulation of treatment event times. Treatment is only a function of time, X, and X_t.
2
Simulation of outcome event times. Outcome is a function of time, X, and X_t, F, Age.
3
Modify dataset so that follow-up times coincide with new treatment and outcome variables.

Simulated treatment times

   Min. 1st Qu.  Median    Mean 3rd Qu.    Max. 
      1      19      49     Inf     Inf     Inf 

Simulated outcome times

   Min. 1st Qu.  Median    Mean 3rd Qu.    Max. 
      1      58      77     Inf     Inf     Inf 

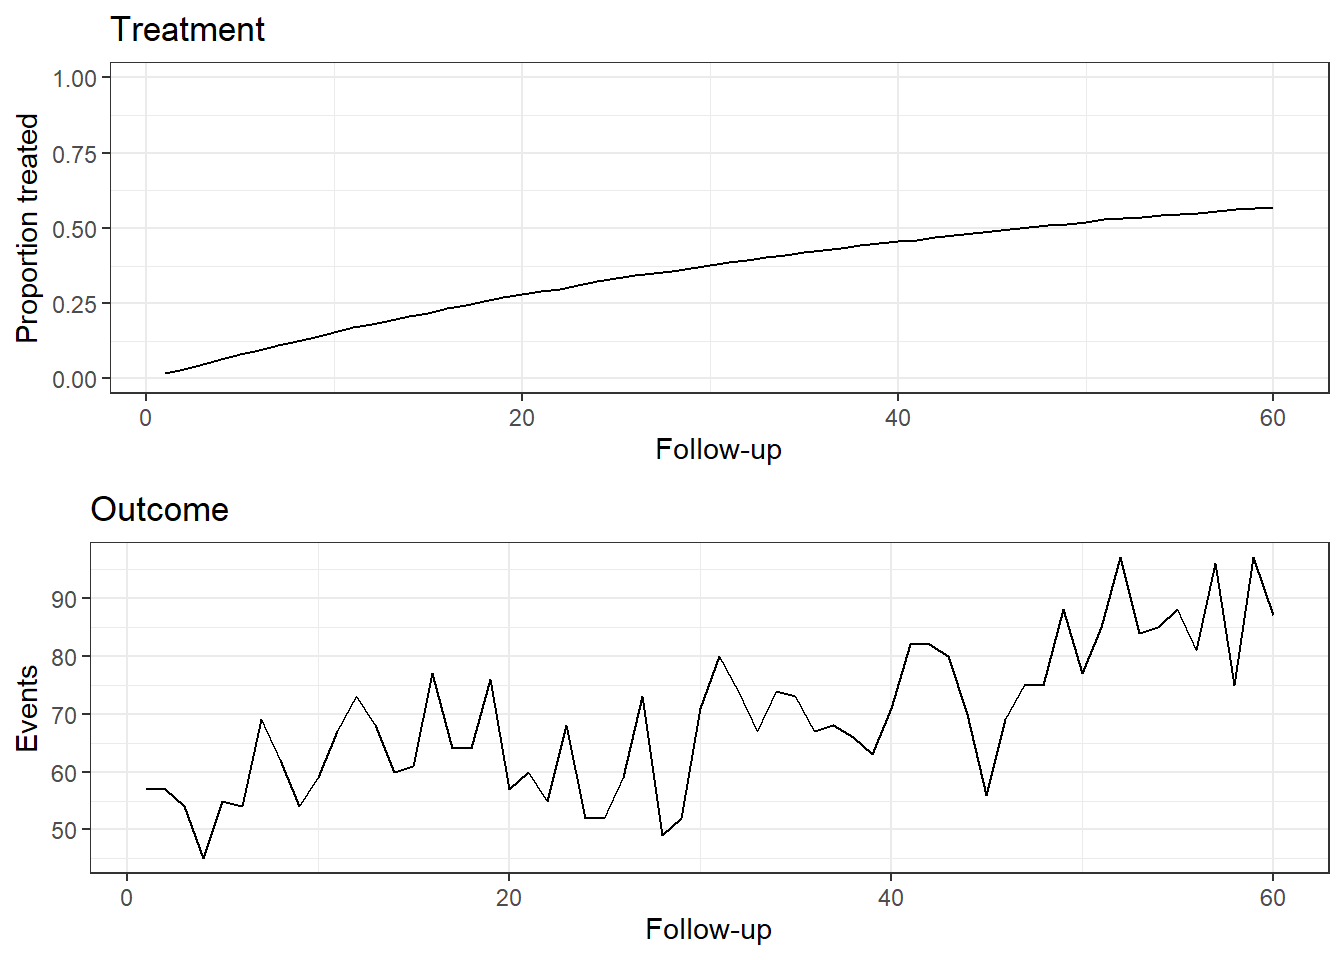
Figure 5. Treatment and Outcome Incidence Across Follow-up

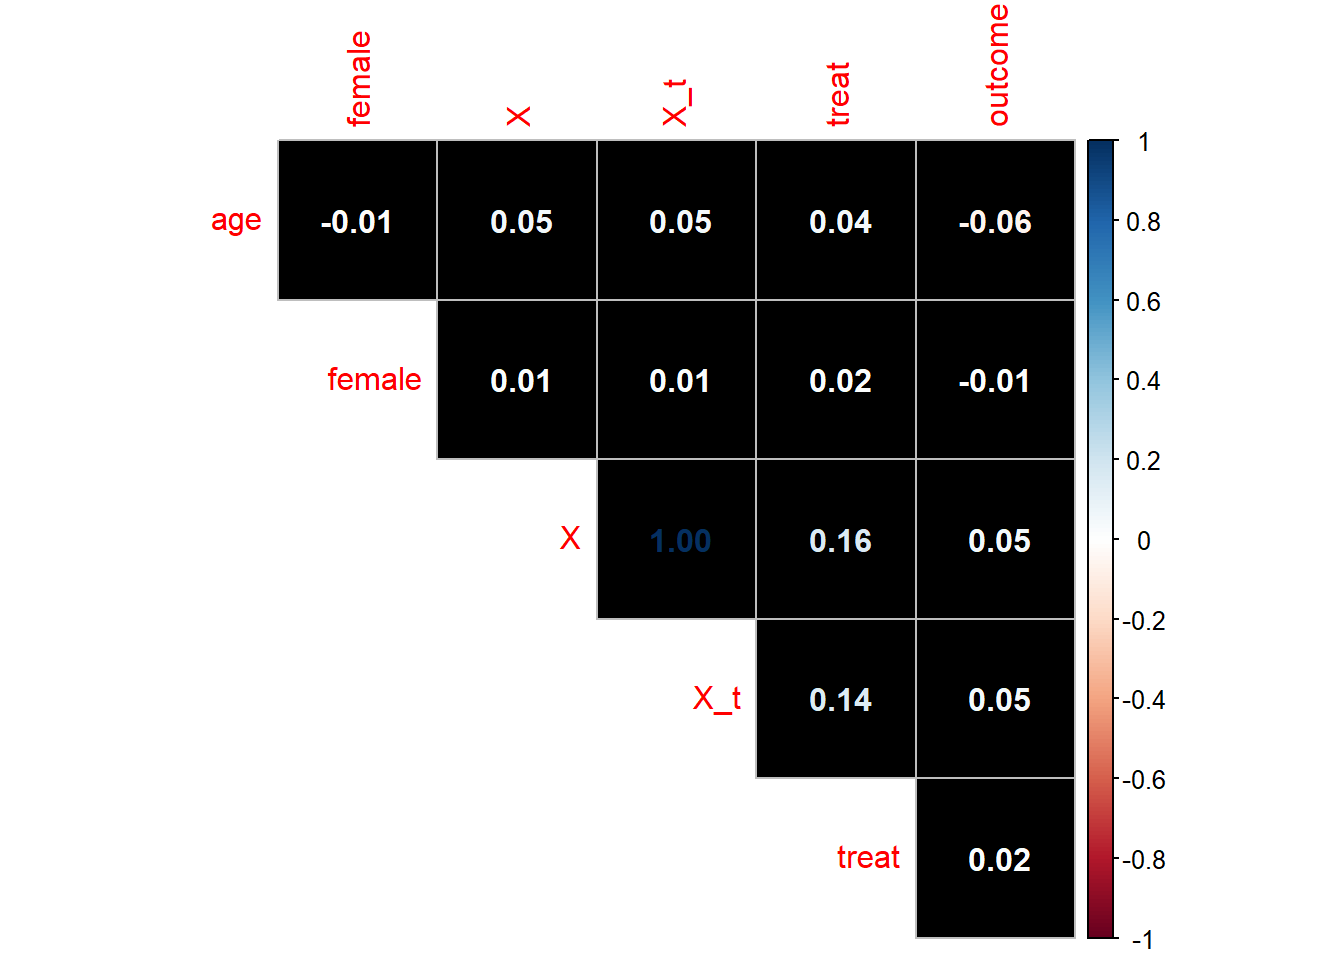
Figure 6. Correlation plot of covariates, treatment, outcome

Simple correlation statistics support the simulated dataset has target associations.

Summary of survival dataset

Rows: 486,944
Columns: 16
$ id        <int> 1, 1, 1, 1, 1, 1, 1, 1, 1, 1, 1, 1, 1, 1, 1, 1, 1, 1, 1, 1, …
$ age       <dbl> 70, 70, 70, 70, 70, 70, 70, 70, 70, 70, 70, 70, 70, 70, 70, …
$ female    <dbl> 0, 0, 0, 0, 0, 0, 0, 0, 0, 0, 0, 0, 0, 0, 0, 0, 0, 0, 0, 0, …
$ fup       <dbl> 90, 90, 90, 90, 90, 90, 90, 90, 90, 90, 90, 90, 90, 90, 90, …
$ X         <dbl> -0.7311102, -0.7311102, -0.7311102, -0.7311102, -0.7311102, …
$ exit      <int> 1, 2, 3, 4, 5, 6, 7, 8, 9, 10, 11, 12, 13, 14, 15, 16, 17, 1…
$ enter     <dbl> 0, 1, 2, 3, 4, 5, 6, 7, 8, 9, 10, 11, 12, 13, 14, 15, 16, 17…
$ time      <int> 1, 2, 3, 4, 5, 6, 7, 8, 9, 10, 11, 12, 13, 14, 15, 16, 17, 1…
$ X_shift   <int> 0, 0, 0, 0, 0, 0, 0, 0, 0, 0, 0, 0, 0, 0, 0, 0, 1, 1, 1, 1, …
$ X_t       <dbl> -0.7311102, -0.7311102, -0.7311102, -0.7311102, -0.7311102, …
$ log_odds  <dbl> -5.502477, -5.492577, -5.482077, -5.470977, -5.459277, -5.44…
$ p         <dbl> 0.004060109, 0.004100338, 0.004143439, 0.004189494, 0.004238…
$ treat     <dbl> 0, 0, 0, 0, 0, 0, 0, 0, 0, 0, 0, 0, 0, 0, 0, 0, 0, 0, 0, 0, …
$ outcome   <dbl> 0, 0, 0, 0, 0, 0, 0, 0, 0, 0, 0, 0, 0, 0, 0, 0, 0, 0, 0, 0, …
$ t_outcome <dbl> 46, 46, 46, 46, 46, 46, 46, 46, 46, 46, 46, 46, 46, 46, 46, …
$ t_treat   <dbl> Inf, Inf, Inf, Inf, Inf, Inf, Inf, Inf, Inf, Inf, Inf, Inf, …
Cloning procedure

The cloning procedure is very project specific, tied to how the treatment strategy is defined so it is hard to give general recommendations here. For this tutorial, we describe an arbitrary window in which treatment is expected to initiate and outline strategies around this:

Treatment Strategies:

  1. Do not ever receive treatment

  2. Initiate treatment within 12 time periods (days, weeks etc.) and if not then treatment will initiate on week 12

Note

The grace window is a funny concept when you first consider it. This does not reflect any trial I have ever heard of actually being done but may identify an interesting or important effect. It is essentially outlying a treatment “protocol” and saying what if everyone adhered to this protocol counterfactual to what was observed.

To clone, you make two copies of the data, and make a new artifical censoring variable, which is a censoring time for the period when clones observed data are no longer consistent with their assigned strategy.

1data_cloned = bind_rows(
                     d_panel_2 %>%
                       mutate(assign = 0,
                              censor = if_else(t_treat <= time, 1L, 0L),
                              event = if_else(censor==0 & t_outcome<=time, 1L, 0L),
                       ),
2                     d_panel_2 %>%
                       mutate(assign = 1,
                              censor = if_else(t_treat > 12 & time>=12, 1L, 0L),
                              event  = if_else(censor==0 & t_outcome<=time, 1L, 0L)
                              )
                       ) %>%
  arrange(id, assign, time) %>%
  group_by(id, assign) %>%
  mutate(t_censor = min(time[censor==1])) %>%
3  dplyr::filter(censor == 0 | time == min(time[censor==1])) %>%
  ungroup %>%
  select(id, time, t_outcome, t_treat, t_censor, censor, event, assign, enter, exit, everything(), -fup, -X_shift, -log_odds, -p)
1
Clones assigned to strategy 1 (No treatment)
2
Clones assigned to strategy 2 (grace window for treatment)
3
Update failure times and events counting for artificial censoring

Summary of simulated, cloned data-set

assign 0 1
Unique persons 10000 10000
Median (Follow-up) 30 12
Total treat (ever) 5116 5116
Total treat (t<=12) 1768 1768
Total events 2380 1364
Total censored 5116 7659

A person-level version of the data is also created (excluded time-varying X) for comparison:

data_cloned_p = data_cloned %>%
  group_by(id, assign) %>%
    mutate(t_censor = min(time[censor==1])) %>%
  ungroup %>%
  mutate(time = pmin(t_censor, t_outcome, 60),
         event = case_when(
           time==t_censor ~ 0, 
           time==t_outcome ~ 1,
           T ~ 0)) %>%
  select(id, assign, t_treat, t_outcome, t_censor, time, event, X, female, age) %>%
  distinct()