Estimation

Introduction

Case Study

For the following, I simulated a dataset with treatment, treat or A, and treatment strategy assign which is either 1) receive treatment by time period 12, or 2) never receive treatment through follow-up. The outcome Y is designed to be a function of treat, X, age and gender (female). While initiation of treatment is a function of X only. X is recorded as the baseline value at time zero, and X_t which varies across time.

So the naive estimate, not adjusting for X should identify a positive association between treatment and outcome, while adjustment for X and X_t should find a null association. This data and assumptions are used to validate the code procedures below.

See: Data for full explanation of procedure for generating data.

Stepwise approach

I recommend the following stepwise procedure in estimation:

PLR

Pooled Logistic Regression, a model which approximates the hazards by discretizing follow-up time.

KM

Kaplan-Meier, non-parametric estimator which computes the instantaneous hazard at points of follow-up. Does not allow for time-varying confounding, but the non-parametric evaluation of time-trends can be useful for diagnostics and model specification of the PLR.

  1. Estimate unweighted/unadjusted cumulative incidences with KM method
  2. Estimate a PLR model without weights
  1. Compare KM vs PLR
  1. Estimate censoring weights
  1. Estimate PLR for treatment initiation

    A. Estimate treatment model

    B. Compare KM / PLR estimates

    C. Compute IPCW

    D. Examine IPCW weights for extreme values, non-sensical values

    E. Examine balance in covariates across time

  2. Generate “table 1” with some weighted difference statistic (e.g. wSMD)

  1. Estimate weighted outcome models
  1. Estimate a weighted outcome model, no covariate adjustment
  2. Estimate a weighted outcome + covariates (usually main estimate)
  1. Once satisfied with stability from steps 1-4, execute bootstraps
  2. Finalize report
  1. provide KM, Cox unweighted, and PLR unweighted estimates in an appendix
  2. main results reported should be the IPCW-weighted PLR analysis
Note

Pooled logistic regression is an important statistical model for target trial emulation because of its flexibility in estimating weights for time-varying confounding and the estimation of cumulative incidences. The PLR model approximates the hazards with some assumptions, see Technical Point 17.1 on page 227 of Causal Inference: What If, which explains why the odds approximates the hazard at a given time-point k, as long as the hazard is small (i.e. rare event) at time k.

Kaplan-Meier Estimator

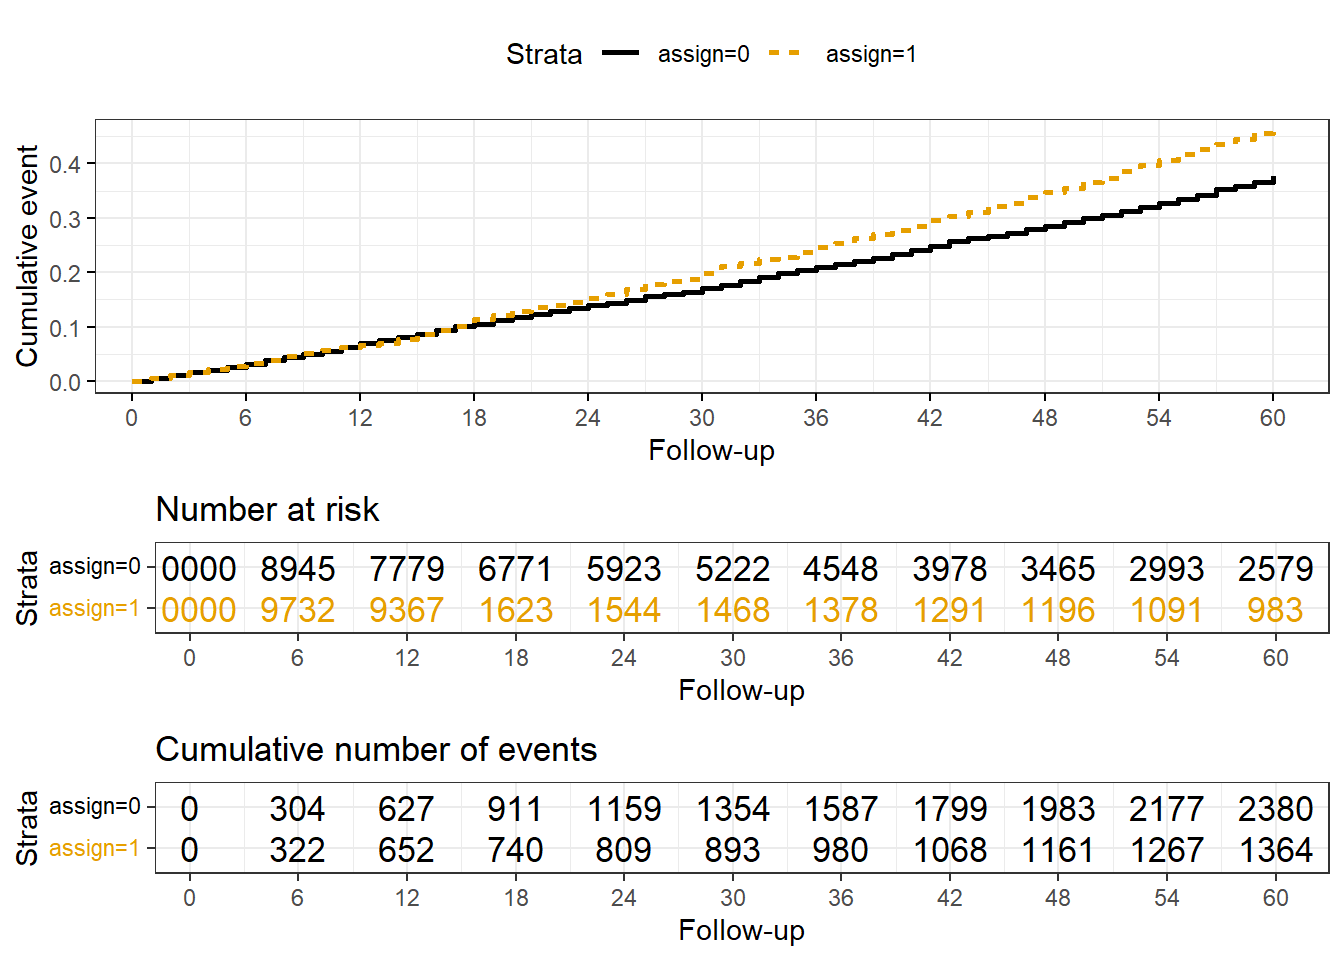
A reasonable starting point is to evaluate the cloned dataset without probability weighting or pooled logistic regression models. Although this estimator is “naive” in that the artificial censoring is not considered, it is useful for the following reasons:

  1. It allows examination of the overall time trends, censoring and sample size which can reveal fatal issues with the target trial emulation. For example, treatment is too rare in the grace window used, or event rate is unexpectedly high or low.

  2. The non-parametric model allows a visual examination of the cumulative incidences (or event free survival probabilities) which are modeled parametrically in the pooled logistic regression. In other words, examining the time trend can help you determine if a simple polynomial or some more complex spline function is needed. This is not definitive however, because time-varying weights may change the time trends. But in my experience the unadjusted curve provides a good starting point, and practitioners should be very skeptical of weighted analysis that shows dramatically different time trends then the unweighted analysis (e.g. more likely to be an error in coding than real).

Data

We continue the below using the cloned dataset generated in Data.

glimpse(dta_c_person)
Rows: 20,000
Columns: 10
$ id        <int> 1, 1, 2, 2, 3, 3, 4, 4, 5, 5, 6, 6, 7, 7, 8, 8, 9, 9, 10, 10…
$ assign    <dbl> 0, 1, 0, 1, 0, 1, 0, 1, 0, 1, 0, 1, 0, 1, 0, 1, 0, 1, 0, 1, …
$ t_treat   <dbl> Inf, Inf, 20, 20, Inf, Inf, 22, 22, 16, 16, Inf, Inf, 24, 24…
$ t_outcome <dbl> 46, 46, Inf, Inf, 77, 77, Inf, Inf, 73, 73, 87, 87, 67, 67, …
$ t_censor  <dbl> Inf, 12, 20, 12, Inf, 12, 22, 12, 16, 12, Inf, 12, 24, 12, 1…
$ time      <dbl> 46, 12, 20, 12, 60, 12, 22, 12, 16, 12, 60, 12, 24, 12, 14, …
$ event     <dbl> 1, 0, 0, 0, 0, 0, 0, 0, 0, 0, 0, 0, 0, 0, 0, 0, 0, 0, 0, 0, …
$ X         <dbl> -0.7311102, -0.7311102, -2.5249386, -2.5249386, -0.6470915, …
$ female    <dbl> 0, 0, 1, 1, 1, 1, 1, 1, 1, 1, 1, 1, 1, 1, 1, 1, 1, 1, 1, 1, …
$ age       <dbl> 70.0, 70.0, 76.3, 76.3, 74.2, 74.2, 83.9, 83.9, 76.2, 76.2, …
Estimation

  d_km_est = broom::tidy(
1    survfit(Surv(time, event) ~ assign, data=dta_c_person)) %>%
    mutate(assign = str_extract(strata,  '(?<=assign=)\\d')
    ) %>%
    arrange(time) %>%
    select(-strata) %>%
2    mutate(pr_ev = 1-estimate) %>%
    rename(pr_s = estimate) %>%
3    pivot_wider(id_cols = c(time),
                names_from = assign,
                values_from = c(pr_ev, pr_s,
                                n.risk, n.event)) %>%
4    mutate(cir = pr_ev_1 / pr_ev_0,
           cid = (pr_ev_1 - pr_ev_0))
1
Naive estimator, K-M estimator, assignment is by clone (not person). t_clone is the follow-up time for each clone, taking into account artificial censoring.
2
estimate from the model is the survival probability, so probability of event is 1 - estimate
3
Data is in long form, so one colum per group with cumulative incidence/survival
4
Estimands, cir is ratio analogous to relative risk, and cid is analogous to risk difference

Summarize KM estimator

Cox Proportional Hazards

The data was designed so treatment has no causal effect on outcome, but confounding is present Data. Adjustment for confounder, X identifies null effort of assignment.

Characteristic HR 95% CI p-value
assign 0.96 0.90, 1.03 0.3
X 1.92 1.86, 1.99 <0.001
Abbreviations: CI = Confidence Interval, HR = Hazard Ratio

Pooled logistic regression

Next, we proceed to essentially replicate the finding of the KM estimator with a PLR model. No weights or covariate-adjustment is applied yet. These steps are computationally intensive and so this step is important to test your code. Make sure you have a good starting parametric model for the outcome to avoid any major issues downstream when you add weights. An unadusted PLR model should closely approximate the KM curves, if it doesn’t then something is wrong.

Estimation

The PLR model requires specification of a function of time. This choice is informed by the KM estimator plot of the cumulative incidences, but a polynomial is a good starting point (i.e. time + time^2). Choose either to estimate the outcome in a model with both clones combined in one dataset OR estimate cumulative incidences separately (two models with data limited to assign==1 & assign==0 respectively). In the combined data, you must specify an interaction between treatment (clone assignment) and time, e.g. time + time^2 + treat + treat*time + treat*time^2, shorthand below is poly(time, 2, raw=T)*assign.

  # defined above
1  d_glm = glm(event==0 ~ poly(time, 2, raw=T)*assign, data=dta_c_panel, family=binomial())
  
  d_plr_naive_est = crossing(assign = 1:0, time = 1:60)
  
  d_plr_naive_est$pr_surv = predict(d_glm, newdata = d_plr_naive_est, type = 'response') 
  d_plr_naive_est = d_plr_naive_est %>%
    group_by(assign) %>%
    mutate(pr_cumsurv = cumprod(pr_surv),
2           pr_cumev = 1 - pr_cumsurv) %>%
3    ungroup %>%
    pivot_wider(., id_cols =c('time'),
                names_from = assign,
                names_prefix = 'pr_ev_',
                values_from = pr_cumev
    ) %>%
    mutate(cid = pr_ev_1 - pr_ev_0,
           cir = pr_ev_1 / pr_ev_0)
1
PLR model, with time*treat interaction. Binomial family for logistic regression.
2
The cumulative incidence is 1 - cumulative event-free survival probability. To compute, you take the cumulative product by assignment group.
3
Reorganize data and summarize by group/time similar to above for the KM estimator.

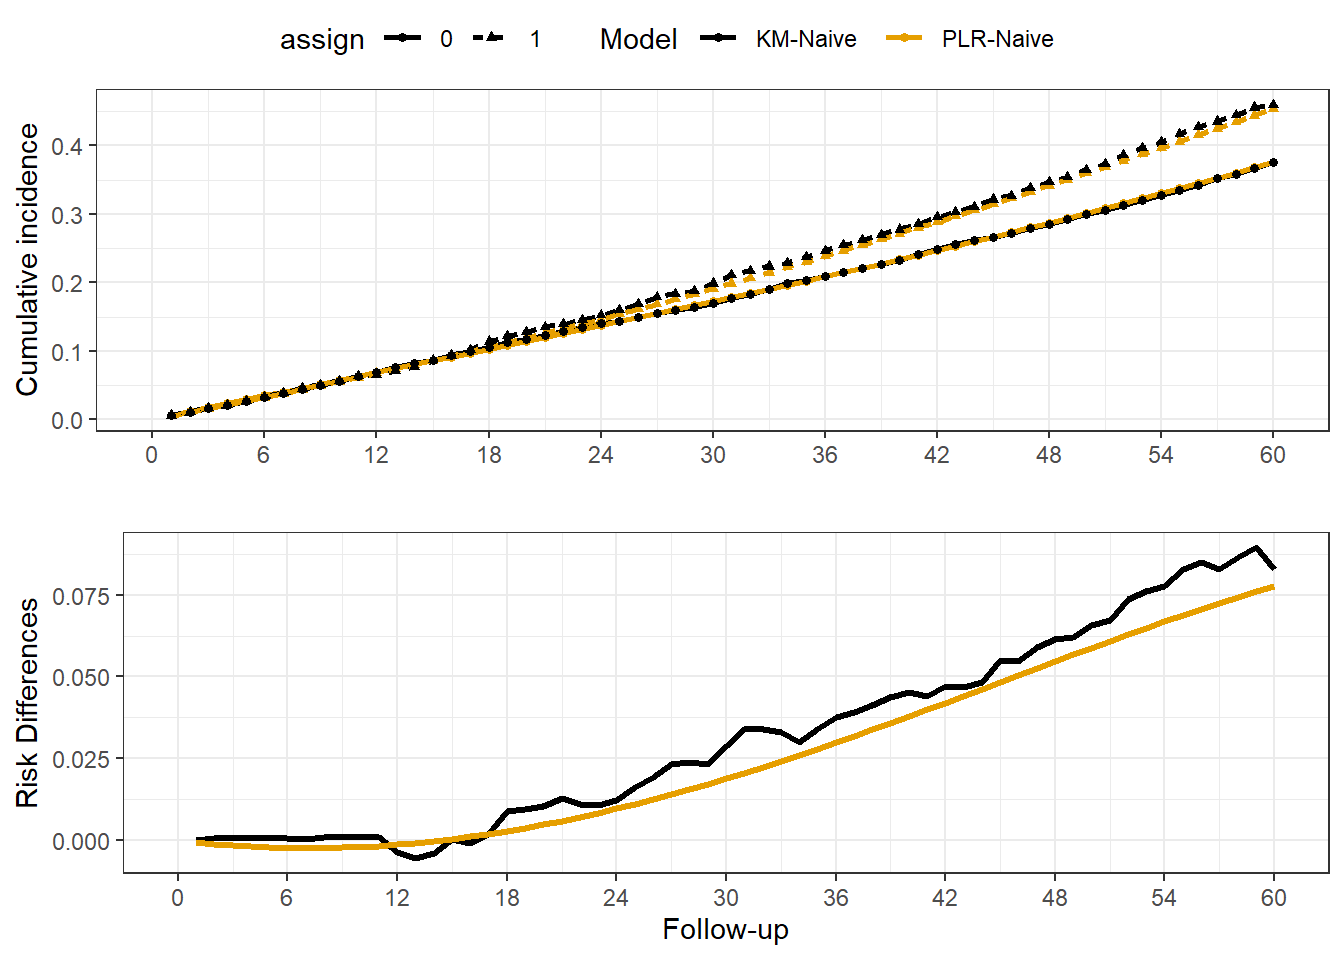
At first glance, the plot looks reasonable. Direct comparison of the PLR and KM estimators is helpful for diagnosing problems in code or modeling steps.

Comparison of Naive PLR versus KM estimator

So the PLR model using a simple polynomial can reasonably approximate the KM estimate. This should work because the underlying synthetic data was generated with an exponential distribution for time, but real-world data will not play so nicely. There is some noise between the KM estimator risk differences across certain time-points. At this point it would be a project specific judgement whether to accept this, or test out other parametric functions. Consider the following regarding the parametric time trend:

  1. It may not matter if PLR and KM are inconsistent at earlier time-points if the plan is to only summarize the results at later periods.

  2. The non-parametric KM estimator may be imprecise with small sample sizes and/or rare outcomes. The risk difference estimates at each time-point may have considerable random variation, and the parametric model is essentially smoothing out this noise. So while they should be approximately the same, you do not want to overfit the random noise of the KM estimator.

  3. These initial steps will not guarantee a good fit after weighting is applied, it is only a first-look for diagnostic purposes.

Comparison of Covariate-adjusted PLR with Cox model

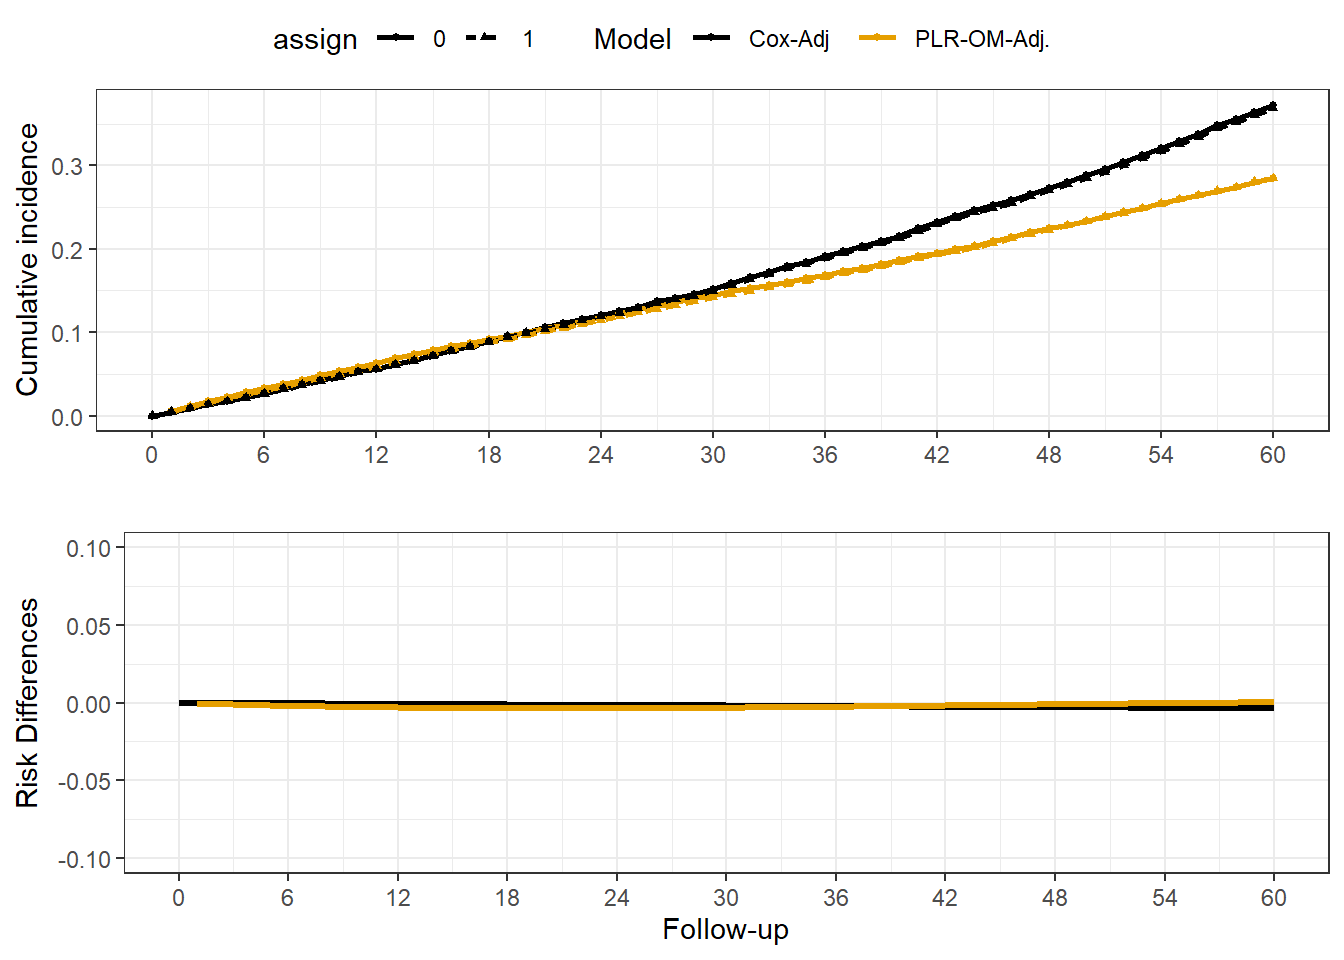
Another approach is to compare a pooled logistic regression analysis to a time-invariant Cox model. If time-varying confounding not an issue, this should give a similar result. However, censoring weights are still necessary in final analysis even if no confounding.(Cain et al. 2010)

# defined above
1  d_glm = glm(event==0 ~ poly(time, 2, raw=T)*assign + female + age + X,
              data=dta_c_panel, family=binomial())

2  dta_c_panel$p.noevent0 <- predict(d_glm, mutate(dta_c_panel, assign=0), type="response")
  dta_c_panel$p.noevent1 <- predict(d_glm, mutate(dta_c_panel, assign=1), type="response")
  
  setDT(dta_c_panel)
3    dta_c_panel[, `:=`(pr_surv_1 = cumprod(p.noevent1)), by=list(id, assign)]
    dta_c_panel[, `:=`(pr_surv_0 = cumprod(p.noevent0)), by=list(id, assign)]
  setDF(dta_c_panel)
  
4  d_plr_adj_est = dta_c_panel %>%
    group_by(time) %>%
    summarize(pr_ev_1 = mean(1-pr_surv_1),
              pr_ev_0 = mean(1-pr_surv_0), 
              .groups = 'drop') %>%
    ungroup %>%
    mutate(cid = pr_ev_1 - pr_ev_0,
           cir = pr_ev_1 / pr_ev_0)
1
PLR model with some covariates for adjustment. (model fit for each treatment group)
2
Predict outcome under each assignment strategy.
3
Estimate cumulative survival using cumulative product, within person-clone
4
Summarize mean survival rates by time-period
Note

Note the outcome regression without weights is just for comparison and understanding, the final analysis must include probability weights for artificial censoring even if no confounding.

  d_cox = coxph(Surv(enter, exit, event) ~ assign + female + age + X, data = dta_c_panel)

  d_cox_est = surv_adjustedcurves(fit = d_cox, variable = "assign", data = dta_c_panel) %>%
      group_by(variable, time) %>%
        dplyr::filter(row_number()==1) %>%
      ungroup %>%
      mutate(pr_ev = 1 - surv) %>%
      pivot_wider(., id_cols =c('time'),
                  names_from = variable,
                  names_prefix = 'pr_ev_',
                  values_from = pr_ev
      ) %>%
      mutate(cid = pr_ev_1 - pr_ev_0,
             cir = pr_ev_1 / pr_ev_0)

For comparison, A time-dependent Cox model is fit.

  1. Cox model, with time1, time2 parameters which represent the start and stop time of each interval. Note that althought the cox model is time-dependent and you could adjust for X_t this could be problematic, because X_t also includes time-points post treatment. In our synthetic data, X_t is not a collider (Treat -> X_t <- Outcome) or on the causal path (Treat -> X_t -> Outcome).

  2. Estimation of adjusted survival curves by treatment group, with subpopulations balanced using conditional method.(“A Comparison of Different Methods to Adjust Survival Curves for Confounders - Denz - 2023 - Statistics in Medicine - Wiley Online Library,” n.d.)

  3. Summarizing survival probabilities by time

The PLR and Cox models both appropriately find no difference in risk by treatment assignment.

IPCW Pooled Logistic Regression

Once the basic procedures are setup and there is some confidence in the ability to model the cumulative incidences, weighting can begin.

Note

There is no consideration here to model training, causal DAGs or covariate selection. It is simply a toy example to show the procedure.

Build a longitudinal panel

The person- or clone-level data must be expanded to a longitudinal panel where each observation (row) is a period of follow-up.

Censoring dataset

In our example, artificial censoring is tied to whether treatment is initiated within a grace window or not. This is specific to a project’s definitions of treatment so proceed with caution. The basic idea is that since clones censor according to whether treatments starts (or not), the probability of censoring is essentially the probability of initiating treatment. So we can use the clones assigned to no treatment across all follow-up timepoints.

  1. This may be a little confusing, but I am taking clones where assign=0 from the dta_c_panel dataset which is a person-clone level dataset. These are clones assigned to not receive treatment, so their censoring time is time of treatment start.
  2. We are estimating time to treatment, not outcome. The clone, assign=0 is already set up for this but for other projects this step will have to be modified if the comparator is different.

Estimation of weights

The probability weight, AKA inverse probability censoring weight (IPCW) or inverse probability of no loss to follow-up is estimated in this way:

\[ W^C_i = \prod^{T}_{t_0} \frac{P(C_t = 0| \overline{C}_{t-1} = 0)}{P(C_t=0 | X=x, \overline{L}_{t-1}=l_{i, t-1}, \overline{C}_{t-1}=0)} \]

C in this case means censoring, but censoring occurs according to treatment strategy, so it really is the probability of adhering to the treatment you were assigned to. Stabilized weights are tricky, here we are using the marginal stabilized weight which is the probability of no censoring at each timepoint. The denominator is the conditional probability accounting for fixed, i.e. baseline, (X) and time-varying (L) covariates.

We fit a model with the outcome of censoring, including the key variables. Then we add fitted probabilities back to the outcome dataset, and calculate cumulative probabilities and weights.

  # Numerator (margin probability)
1  d_glm_wt = glm(treat ~ poly(time, 2, raw=T),
                 data=dta_c_panel[dta_c_panel$assign==0, ], family=binomial())
  
  dta_c_panel$pr_censnum = predict(d_glm_wt, newdata = dta_c_panel, type='response')

  # Denominator 
2  d_glm_wt = glm(treat ~ poly(time, 2, raw=T) + X + X_t,
                 data=dta_c_panel[dta_c_panel$assign==0, ], family=binomial())
  
  dta_c_panel$pr_censdenom = predict(d_glm_wt, newdata = dta_c_panel, type='response')
1
Marginal probability of no censoring.
2
Conditional probability (covariate-adjusted) for no censoring
Note

There is some controversy in this procedure. Others have not modeled the censoring probability off of a person-unique (no clones) dataset with treatment times, but rather directly in the cloned dataset with the outcome of “censoring” where that may mean treatment initiation or some other thing.(Gaber et al. 2024)

Calculation of weights

This step is highly specific to a project and must be considered carefully. I have found this step is the most prone to errors due to coding or misunderstandings about what the treatment strategy entails, or if the data is setup incorrectly. I refer you to the Weighting section for further discussion.

  setDT(dta_c_panel)
  
  dta_c_panel[, ipw := fcase(
1    assign==0 & censor==0, 1 / (1-pr_censdenom),
    assign==0 & censor==1, 0,
2    assign==1 & time < 12, 1,
3    assign==1 & time == 12  & t_treat  < 12, 1,
4    assign==1 & time == 12  & t_treat  ==12 & censor==0, 1 / (pr_censdenom),
5    assign==1 & time == 12  & t_treat  >12 & event==0, 0,
6    assign==1 & time == 12  & t_treat  >12 & event==1, 1,
7    assign==1 & time > 12, 1
  )]
  
8  dta_c_panel[, marg_ipw := fcase(
    assign==0 & censor==0, (1-pr_censnum) / (1-pr_censdenom),
    assign==1 & time == 12 & t_treat   ==12 & censor==0, pr_censnum / (pr_censdenom),
    default = ipw
  )]
  
9  dta_c_panel[, `:=`(ipw = cumprod(ipw),
                     marg_ipw = cumprod(marg_ipw)),
               by=list(id, assign)]
1
(assign=0) Cumulative probability of no vaccination = Probability of remaining uncensored
2
(assign=1) Clones cannot artificially censor prior to grace period
3
(assign=1) If treatment started prior to grace window ending, the clone cannot censor
4
(assign=1) If a clone is treated in the final period, then the probability of remaining uncensored is the probability of initiating treatment by the final period OR (1 - cumulative probability of no treatment at time-point of grace window).
5
(assign=1) If a clone is not treated, and does not die (event=1) they censor at the end of the window
6
If died in last interval (event=1), do not set weight to zero. This is a misstep others have done, if the person dies at the end of the interval, then that is still consistent with treatment strategy (i.e. they died before end of grace window when they were supposed to recieve treatment) so they are not censor=1 and death is counted.
7
(assign=1) Set post-grace period weights = 1 for all.
8
For a marginal IPW, numerator of 1 is replaced with marginal probability of censoring at each tiempoint.
9
After setting these conditions, compute the cumulative product of the weights.

Overall IPW Distribution

Unstabilized weights

   Min. 1st Qu.  Median    Mean 3rd Qu.    Max. 
  1.000   1.000   1.149   1.933   1.494 163.031 

Marginal Stabilized weights

   Min. 1st Qu.  Median    Mean 3rd Qu.    Max. 
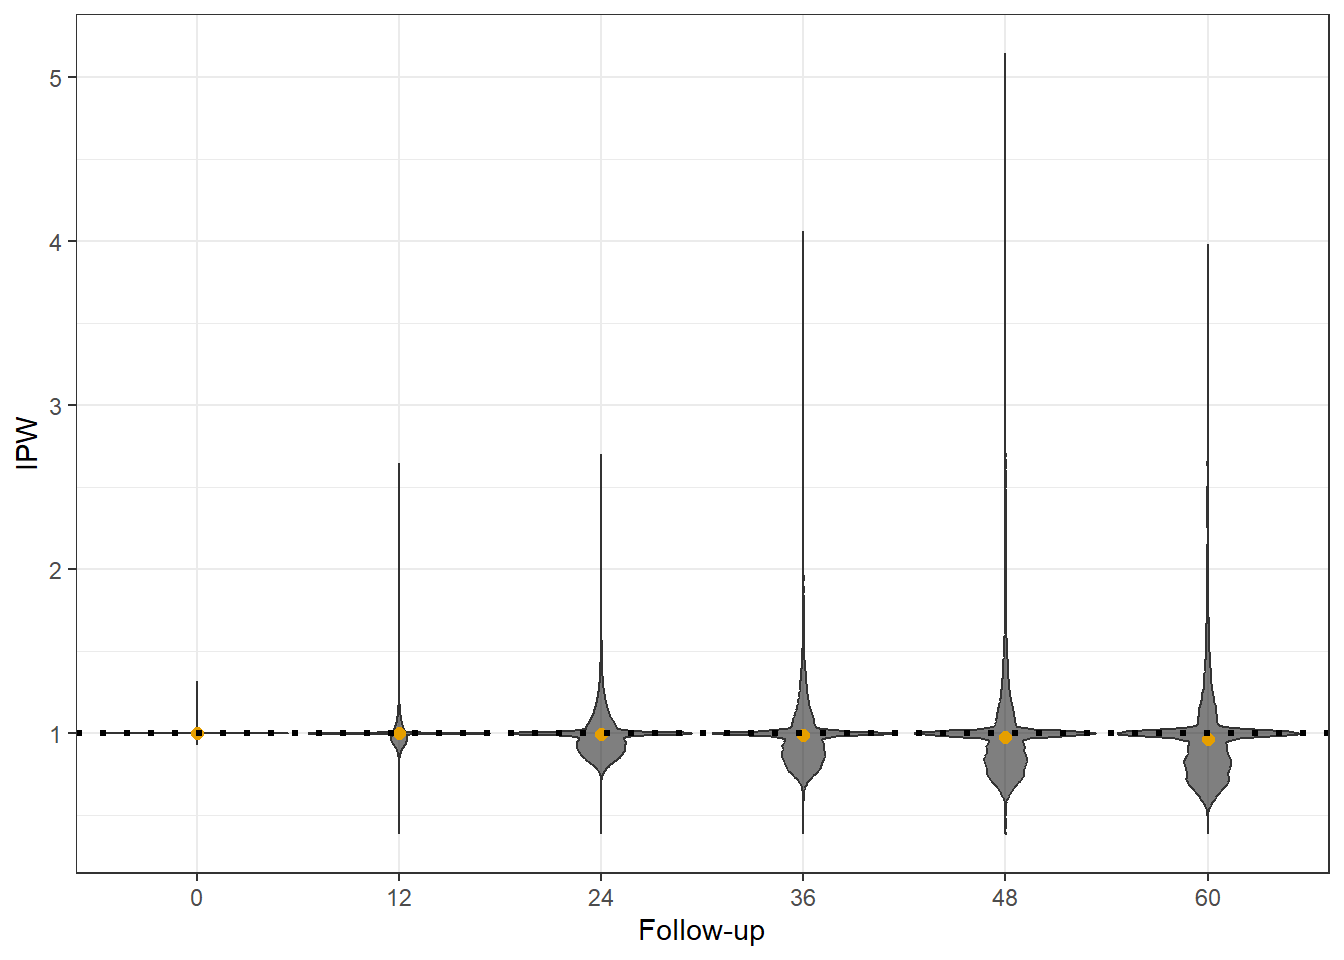
 0.3825  0.9523  1.0000  0.9925  1.0006  5.1434 

The unstabilized weights floor at 1, and we see high weights assigned to some. The marginal weights have a mean of 1 (expected).

IPW Distribution at end of grace period for treatment clones

The weights at the end of the grace period are key so its good to examine them directly:

   Min. 1st Qu.  Median    Mean 3rd Qu.    Max. 
  1.000   1.000   1.000   5.344   1.000 163.031 
Note

Be very careful with IPW truncation with this design. If the probability of treatment is very low, then those treated at the end of the grace period will have very large weights. If you truncate at 99% for example, it could mostly just truncate the weights of those treated at the end of the grace period, and this could severely bias estimates. These persons are meant to account for all those being artificially censored in the treatment group for non-treatment and so will likely have large weights by design.

You can also plot weights across time for diagnostics:

dta_c_panel %>%
    dplyr::filter(marg_ipw!=0) %>%
 ggplot(., aes(x = cut_width(time, 12), y = marg_ipw)) +
  geom_violin(aes(group = cut_width(time, 12)), 
               scale = "width", fill = cbbPalette[1], alpha = 0.5) +
  stat_summary(fun = "mean",
               geom = "point",
               color = cbbPalette[2], size=2) +
  geom_hline(aes(yintercept=1),linewidth=1.1, linetype=3) +
  scale_x_discrete(labels = seq(0, 60, 12)) +
  labs(x = "Follow-up", y = "IPW", ) +
  theme_bw()

Distribution of Censoring Weights Across Time

Another way to examine the weights is to look at the weighted counts of individuals at risk, and number of events pre- and post-weighting:

dta_c_panel %>%
  group_by(time, assign) %>%
  summarize(n = sum(ipw!=0), 
            n_wt = sum(ipw),
            .groups = 'drop') %>%
  pivot_wider(id_cols = time, names_from = assign, values_from = c(n, n_wt)) %>%
  dplyr::filter(time %in% c(1, 12, 30, 60)) %>%
  rename(`Time` = time,
         `Unweighted, assign=0` = n_0,
         `Unweighted, assign=1` = n_1,
         `Weighted, assign=0` = n_wt_0,
         `Weighted, assign=1` = n_wt_1,
         ) %>%
  kable(align='c', digits =0) %>%
  kable_styling()
Unweighted and Weighted Counts, N at risk
Time Unweighted, assign=0 Unweighted, assign=1 Weighted, assign=0 Weighted, assign=1
1 9830 10000 10000 10000
12 7659 1708 9342 9128
30 5143 1468 8241 8023
60 2544 983 5937 5804

The size of the unweighted, and weighted counts may identify problems.

Now with the estimated weights, it is simple to generate weighted cumulative incidences:

1  d_glm_pe_1 = glm(event==0 ~ poly(time, 2, raw=T),
                   data=dta_c_panel[assign==1, ],
                   family=binomial(), weights = ipw)

  d_glm_pe_0 = glm(event==0 ~ poly(time, 2, raw=T),
                   data=dta_c_panel[assign==0, ],
                     family=binomial(), weights = ipw)
  
2  dta_c_panel$pr_1 = predict(d_glm_pe_1, newdata = dta_c_panel,
                             type='response')
  dta_c_panel$pr_0 = predict(d_glm_pe_0, newdata = dta_c_panel,
                             type='response')
1
Estimate for each assignment group separately. This isn’t necessary but its good practice, and if you are adjusting for other covariates may give different results. Note the weights = ipw argument. R glm() will generate a warning message because the weighted counts are “non-integer”, but this is expected and not a problem.
2
Fitted probabilities from each model
1  dta_c_panel[, `:=`(pr_cum_1 = cumprod(pr_1)), by=list(id, assign)]
  dta_c_panel[, `:=`(pr_cum_0 = cumprod(pr_0)), by=list(id, assign)]
  
2  d_plrwt_est = dta_c_panel %>%
    group_by(time) %>%
    summarize(pr_ev_1 = mean(1-pr_cum_1),
              pr_ev_0 = mean(1-pr_cum_0), 
              .groups = 'drop') %>%
    ungroup %>%
    mutate(cid = pr_ev_1 - pr_ev_0,
           cir = pr_ev_1 / pr_ev_0)
1
Cumulative product
2
Summarize across group, time as before.

Final Comparison

Table 1: Comparison of estimates by model, cumulative incidences, risk differences and relative risks
Incidence: No treatment initiation ever
time Kaplan-Meier PLR-Naive Cox PLR-Wtd PLR-Stab-Wtd
6 0.032 0.035 0.027 0.036 0.036
12 0.069 0.069 0.056 0.073 0.072
36 0.209 0.209 0.191 0.226 0.226
60 0.376 0.376 0.372 0.416 0.416
Incidence: Treatment initiation at 12 months
time Kaplan-Meier PLR-Naive Cox PLR-Wtd PLR-Stab-Wtd
6 0.032 0.032 0.026 0.033 0.034
12 0.065 0.067 0.056 0.066 0.070
36 0.247 0.238 0.189 0.216 0.248
60 0.459 0.454 0.369 0.405 0.459
Risk Differences
time Kaplan-Meier PLR-Naive Cox PLR-Wtd PLR-Stab-Wtd
6 0.001 -0.002 0.000 -0.004 -0.002
12 -0.004 -0.001 -0.001 -0.007 -0.002
36 0.037 0.030 -0.002 -0.010 0.022
60 0.083 0.078 -0.003 -0.011 0.043
Relative Risks
time Kaplan-Meier PLR-Naive Cox PLR-Wtd PLR-Stab-Wtd
6 1.016 0.929 0.986 0.895 0.934
12 0.946 0.979 0.986 0.909 0.977
36 1.179 1.143 0.988 0.955 1.097
60 1.221 1.207 0.991 0.974 1.103

Note. The IPW-PLR finds a null effect, and similar results to a time-dependent Cox model. PLR = Pooled Logistic Regression, Wtd = with censoring weights, Stab = Marginal Stabilized Weights.

References

“A Comparison of Different Methods to Adjust Survival Curves for Confounders - Denz - 2023 - Statistics in Medicine - Wiley Online Library.” n.d. https://onlinelibrary.wiley.com/doi/10.1002/sim.9681.
Cain, Lauren E., James M. Robins, Emilie Lanoy, Roger Logan, Dominique Costagliola, and Miguel A. Hernán. 2010. “When to start treatment? A systematic approach to the comparison of dynamic regimes using observational data.” The International Journal of Biostatistics 6 (2): Article 18. https://doi.org/10.2202/1557-4679.1212.
Gaber, Charles E., Armen A. Ghazarian, Paula D. Strassle, Tatiane B. Ribeiro, Maribel Salas, Camille Maringe, Xabier Garcia-Albeniz, Richard Wyss, Wei Du, and Jennifer L. Lund. 2024. “De-Mystifying the Clone-Censor-Weight Method for Causal Research Using Observational Data: A Primer for Cancer Researchers.” Cancer Medicine 13 (23): e70461. https://doi.org/10.1002/cam4.70461.