Overview
The following software is a collection of R functions and datasets to examine attributable influenza morbidity and mortality. The software draws from multiple peer-reviewed studies, as well as unpublished SAS and R code developed by other researchers (see acknowledgements).
install.packages(“devtools”)
devtools::install_github(“kmcconeghy/flumodelr”) ``` This package relies heavily on the suite of packages and programming termed “Tidyverse”, e.g. “dplyr”, “lubridate”, that must be installed for proper functioning.
Usage
The primary goal of this package is to provide a toolkit for researchers who wish to estimate the attributable proportion of an outcome due to influenza morbidity and mortality. Conceptually this is achieved through estimating a baseline rate of the outcome in the absence of influenza, then using a measure of influenza endemicity to identify the marginal rate due to influenza morbidity. The particular measure of influenza endemicity and outcome being modelled is specified by the user.
Simple Example
{r, include=F} library(flumodelr, quietly = T, warn.conflicts = F) library(tidyverse, quietly = T, warn.conflicts = F)
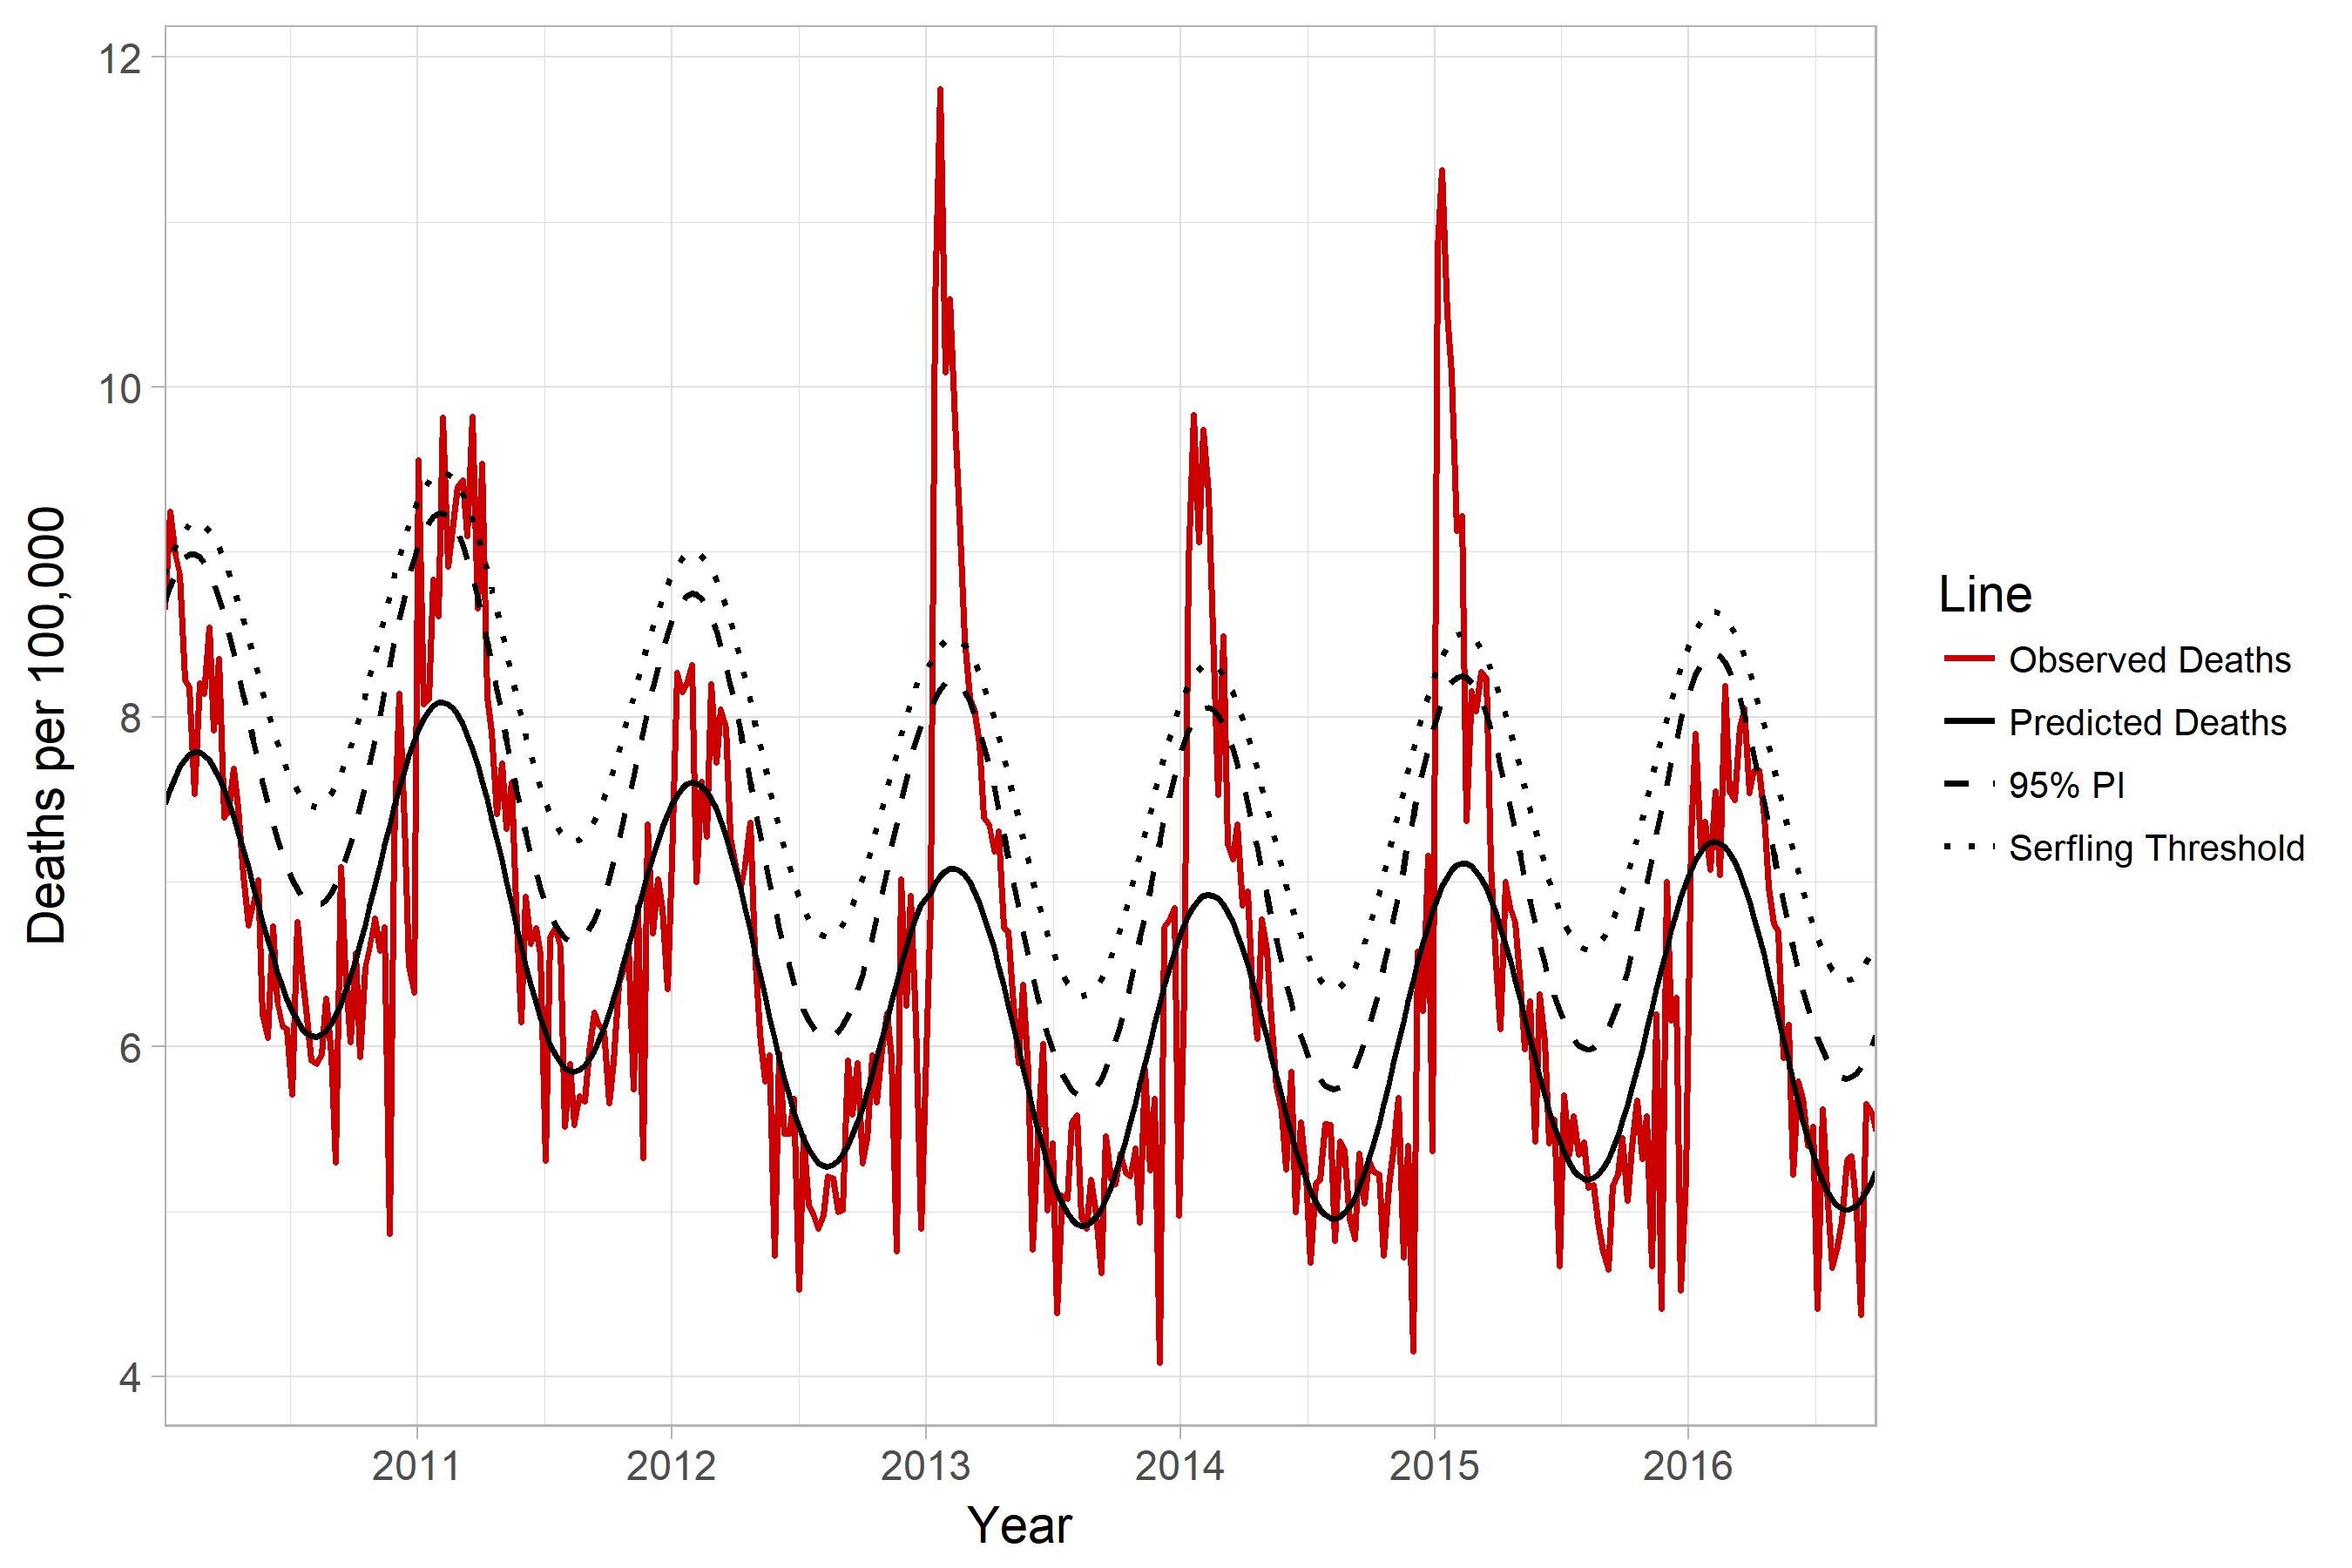
Fit Traditional Serfling Model
{r } flu_fit <- fluserf(fludta, outc = perc_fludeaths, time = yrweek_dt)
Assumes epidemic influenza period of Sept. - May. Fits a cyclical trend line, y0, along with an threshold limit for epidemicity, y0_ul.
{r } flu_fit %>% select (year, week, perc_fludeaths, y0, y0_ul)
Vignettes
Several companion documents have been written to assist interested readers with the background and use of the package. We suggest you start here: Introduction to flumodelr or if the package is installed:{r, eval=F} vignette("01-Introduction", "flumodelr")
Latest Version Updates
This package is in the early stages of development. Many features may change in a short amount of time.
Future Goals for flumodelr
The basic functions of the package have been tested and validated against a published research study. The current goal is focused on streamlining package functions and preparing a manuscript on comparison of methods for publication.
Important References
Serfling RE. Methods for current statistical analysis of excess pneumonia-influenza deaths. Public Health Rep. 1963 Jun; 78(6): 494 - 506. Pubmed Link
Thompson WW1, Weintraub E, Dhankhar P, Cheng PY, Brammer L, Meltzer MI, Bresee JS, Shay DK. Estimates of US influenza-associated deaths made using four different methods. Influenza Other Respir Viruses. 2009 Jan;3(1):37-49. Pubmed Link
Acknowledgements
The programming was derived with guidance and example code from the following individuals.
Yinong Young-Xu and Ellyn Russo. White River Junction VA Medical Center, VT. Department of Veteran Affairs.
Baltazar Nunes. Researcher, Epidemiological Research Unit (Head), Departament of Epidemiology.